Intellecta and Science applications
The Intellecta icon system grew from a need to teach control systems to Civil Aviation students in a control systems class.
Aviation is a good environment for data logging and control because a large number of sensors must be measured and interpreted in a control strategy.
These sensors measure pressure, speed, fuel, temperature, altitude, angle and the raw data is different.
The data must be converted into electrical signals that must be related to the measured variable.
Intellecta can use a large number of sensors that can be calibrated.
These can be linked in the control or data logging process.

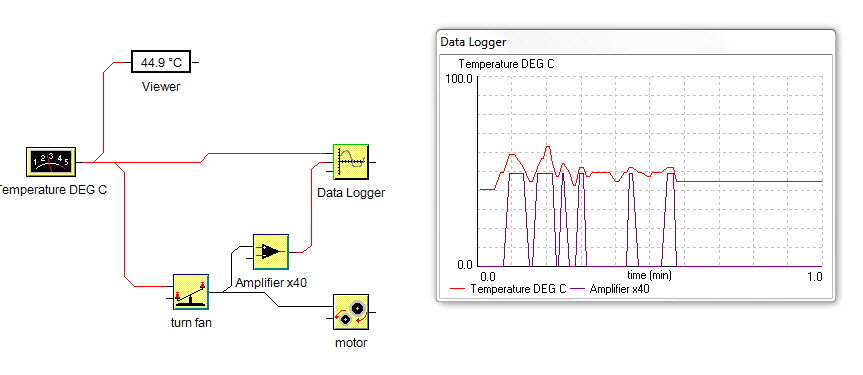
This example shows a typical control process. The temperature is read from a sensor that is calibrated in degrees C. The temperature is shown in the figure command and then passes to the DataLogger icon.
In parallel, the sensor value passes to a comparator icon that compares the temperature with a set point at 50 degrees C.
A motor is turned on when the temperature exceeds 50 Deg C.
The on/off command is multiplied by 40 in the Amplifier icon so the data is easily seen on the Data Logger icon.
The sensor calibration is based on a normal input of 0 to 5V from any sensor.
The sensor is calibrated by measuring the voltage output at 0 deg C in an ice bath and repeating this in boiling water at 100 Deg C.
The calibration function can then fit this to a straight line or curve to convert the o to 5V to 0 to 100 Deg C output.
Intellecta TECHNOLOGIES
Intellecta TECHNOLOGIES